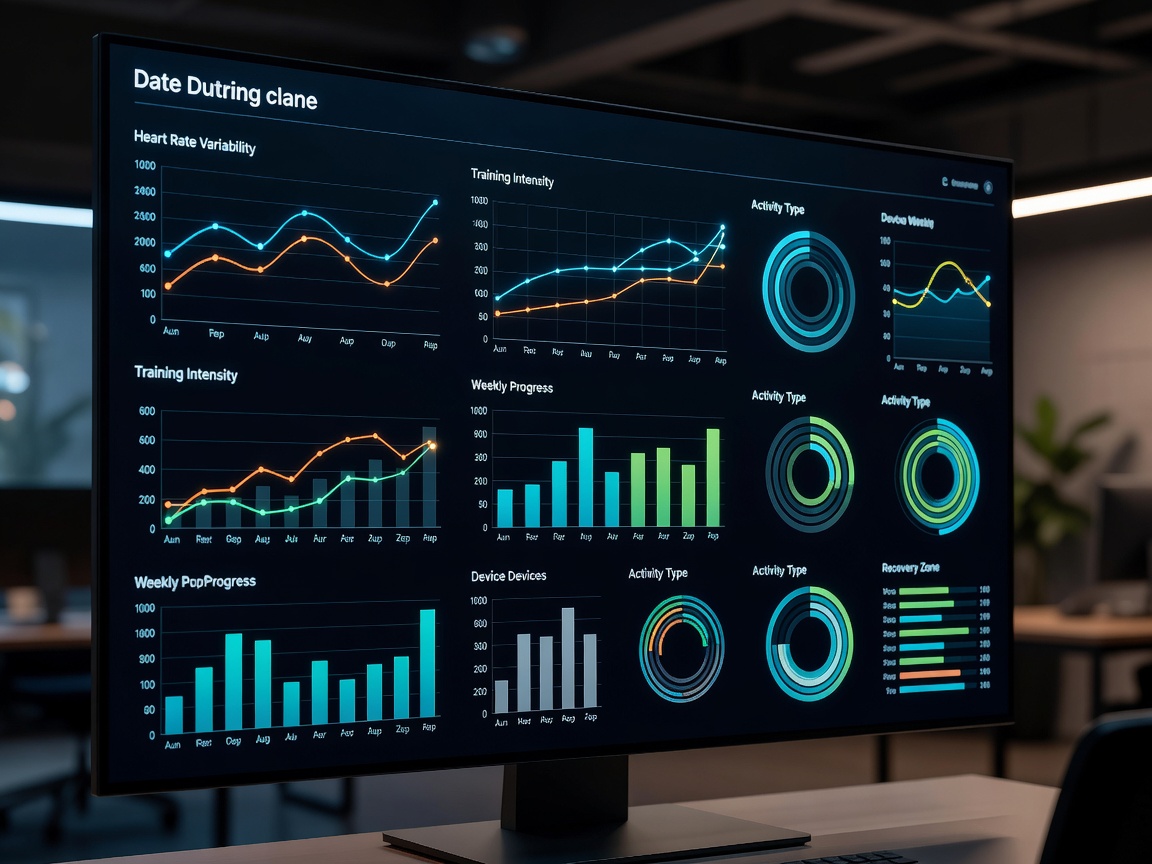
A training dashboard brings recorded sessions and device measurements into one place. It might show duration, pace, distance, heart-rate trends, workload estimates or recovery indicators. Those neat summaries are convenient, but not every figure is a direct measurement and not every recommendation understands your week.
Raw readings, derived metrics and suggestions
A raw measurement is a signal a sensor detects, such as acceleration or a heart-related optical change. A derived metric is calculated from one or more inputs—for example, a distance estimate based on recorded position points. An estimate uses a model to infer a quantity that is not directly observed in the same way. A recommendation goes one step further and proposes an action. Understanding which kind of information you’re looking at helps keep the dashboard in perspective.
Session summaries can make it easier to review what happened, while long-term trends can show how recorded training changes over time. Training volume may be represented through time, distance or another measure. Intensity indicators may combine several inputs. Workload estimates and recovery indicators are software-generated interpretations, not universal facts about how prepared someone is to train.
Trends need consistent data
Comparisons work best when the underlying data are collected in broadly similar ways. Switching devices, changing a sensor’s placement, missing sessions or changing the activities you record may alter a trend. A wrist heart-rate signal during one kind of movement may not be directly comparable with a strap reading in another context. GPS distance and pace can also vary with reception and software processing.
That doesn’t make the data pointless. It means consistency and context matter. Ask what device recorded the session, whether the sensor was worn correctly and whether the activity was comparable. A long-term pattern may provide a useful prompt for reflection, but a single day’s reading rarely tells the whole story.
Recovery and sleep indicators
Some wearable platforms present recovery or sleep estimates. These can help people review routines and notice possible patterns, but they rely on the device’s sensing and interpretation. Sleep estimates are not the same as a clinical sleep assessment. Recovery scores are not a diagnosis or a guaranteed forecast of how a session will feel.
Consider the signal alongside how you feel, your recent training, schedule, stress, illness or other individual circumstances. If a metric repeatedly worries you or seems at odds with your experience, it may be worth stepping back from the number and discussing relevant health concerns with a qualified professional.
Automatic analytics: helpful, but not omniscient
Automatic summaries can save time and make a training history easier to scan. Algorithm-generated conclusions can also hide their assumptions. A device may compress several inputs into a score without showing which factors carried the most weight. The same label can mean different things across platforms, so scores from different systems are not necessarily interchangeable.
Useful questions include: What signal feeds this metric? Is it measured, calculated or estimated? What conditions might affect it? Does the trend persist across comparable sessions? Does the conclusion fit the broader training context? If the software suggests an action, treat it as one input rather than an instruction that outranks your judgment or a qualified coach’s advice.
Privacy, compatibility and data access
Training histories can contain activity patterns, timestamps, routes and other personal information. Review account privacy, sharing defaults, connected apps, permissions and data-retention settings. Check whether you can export records and what happens if you stop using a service. Cross-device compatibility can be limited: files may transfer incompletely, summaries may be recalculated, and the same metric name may represent different methods.
Before adopting a platform, consider how it handles your records and whether its ongoing software support meets your needs. Features vary between services and devices and can change. Don’t assume every dashboard retains or exports the same data.
Good for
People who want to review sessions over time, organize their training record or ask better questions about recurring patterns. Analytics can support informed decisions; they cannot replace qualified coaching or medical advice where appropriate.
What to know
Interpret trends alongside the collection method, your subjective feedback and your individual circumstances. Avoid treating a number as a diagnosis, a universal threshold or proof that one variable caused another. A careful question is often more valuable than a colourful score.
One-day rule: let a single reading start a question, not finish the conversation.